Some statistics from FSCONS 2011
We have now analysed the results from the survey and other data from FSCONS 2011. Of course, the answers coming from the survey have to be taken for what they are, a statistical view of those who took the time to answer the survey, and not necessarily representative for all participants. Here are some of the results:


Gender distribution
Out of the staff and volunteers, 29% were women. Among the speakers, 22% were women. Among the respondents of the survey the following was the result (65 people responded):Male (m) 55 84.62% Female (f) 7 10.77% Other 1 1.54% No answer 2 3.08%
Participant background or occupation
From the survey, we got the following results:Student 12 18.46% Industry 38 58.46% Academical 12 18.46% Other 10 15.38%Some people specified. Those who answered "Industry" and also left a comment, all worked in the ICT or technology sector, for instance "Software Development", "automotive", "Computer security" and "embedded industrial applications". Among those who answered "Other" and also left comments, we found for instance the following: "Government", "Civil Society" or "NGO".
Where did people learn about FSCONS?
I attended FSCONS before 	                     38 	58.46%
I got the suggestion from a friend or colleague      14 	21.54%
I saw an advertisement in a magazine 	              0 	0.00%
I read about FSCONS on the web (please specify)      12 	18.46%
I saw a poster (please specify where) 	              2 	3.08%
I was invited personally (please specify by who)      9 	13.85%
Other (please specify) 	                              6 	9.23%
The "Other" category gave the following examples: "IRC", "Advertised at lecture =)", "I heard about FSCONS from past years", "on an other conference", "I heard about FSCONS last year but I couldn't attend last year".
Participant nationality
32 Swedish
6 German
3 Norwegian
2 British
2 Icelandic
2 French
2 Danish
2 Finnish
2 Italian
2 Iranian
1 US
1 Switzerland
1 Spanish
1 Romanian
1 Polish
1 Dutch
1 Belarus
Where did the respondents live?
Of those who answered, here is a summary of where they live:19 Gothenburg, Sweden 7 Stockholm, Sweden 2 Oslo, Norway 2 Düsseldorf, Germany 2 Copenhagen, Denmark 1 Varberg. Sweden 1 Vantaa, Finland 1 Vänersborg, sweden 1 Tingsryd, Kronoberg, Sweden 1 Stenungsund, Sweden 2 Reykjavík, Iceland 1 Orsa, sweden 1 Norrtälje, Sweden 1 Norrköping 1 near the city of Maastricht, The Netherlands 1 Manchester, UK 1 Malmö, Sweden 1 Madrid, Spain 1 Leonberg, Germany 1 Leicecster, United Kingdom 1 I live in Villetaneuse, near Paris, in France. 1 Espoo, Finland 1 Bergen, Norway 1 Alingsås, Sweden 1 Aachen, Germany
Who paid for the ticket?
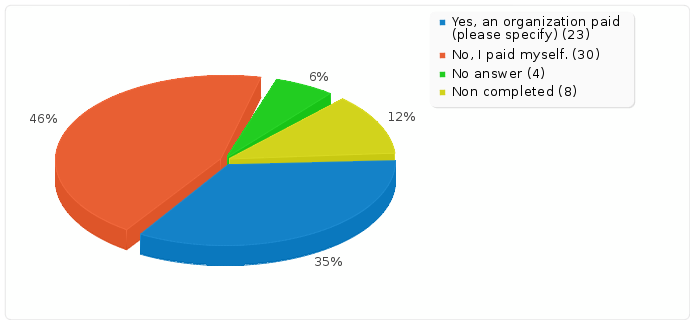
Yes, an organization paid (please specify) (yes) 	23 	35.38%
No, I paid myself. (no) 	                        30 	46.15%

Comments on the registration process
Most people were satisfied with the registration process. Here are some comments that stood out, though:- "You sent out a couple of wrong emails and then had to correct them. That should be fixed."
- "But other ways to pay (BankGirot, BitCoin,...) would be welcome"
- "It took some reading to find out what was an applicable rate for me."
- "it was straight forward, except... I would have been entitled to the FSFE Fellowship discount, but couldn't find documentation how to make use of it."
How much are you ready to pay for the ticket for attending next year's FSCONS? (in euro)
Count 	41
Sum 	3715
Standard deviation 	161.3
Average 	         90.61
Minimum 	          5
1st quartile (Q1) 	109
2nd quartile (Median) 	 50
3rd quartile (Q3) 	 60
Maximum 	       1000
Let's break the figures up in two groups, those who paid for the ticket themselves, and those who didn't:
Paid themselves:
Count:             21
Sum:             1335
Average:           64
Min:               10
Max:              300

Some one else paid:
Count:             17
Sum:             2200
Average:          129
Min:                5
Max:             1000
On-site registration
Most respondents were very happy with the on-site registration and arriving to the conference.Quality of sessions
Answers varied. Here are some comments:- "Varying, as it is to be expected, but on a high level. You *must* get audio into all four rooms. Especially in room four, silent speakers and a high general noise level made things difficult at times."
- "Mostly very good speaker and diversified topics"
- "Everything was good but there was no way for me to anticipate what level of detail or "difficulty" the sessions would have. For example some speakers assumed quite a lot of knowledge while others started from the very basics. I do not mind this spread at all but if there was any way to understand what to expect before attending it would be better (for me)."
- "mostly very good I think it's showing disrespect to the people that arrive in time to delay the start of a session just because some people may be late. It's also bad manners to come and go during the sessions. Unfortunately the trend is that this is getting worse over time."
- "Ranging from 7 to 9 out of 10. Would make more use of tech - it didn't seem enough for a tech conference."
- "Fantastic. It's a great mix of people. Hope you will keep the special mix of speakers. It's feels like anyone is welcome as a speaker, as long they have something interesting to lecture about. That is special!"
- "It varied, some were good some were not so good. Some did not even keep to the topic. Some were replaced with other interesting subjects, which was positive rather than completely cancel it."
- "Generally excellent. In a few cases, I'd have hoped for more depth, but those were generally places where I was more of an expert than most of the audience."
Length of sessions

More about time
